Multiplication graph
I was watching this random video on youtube (which by the way is not the best video) that I thought maybe I can do the same thing. So, I started coding in Sage. Here is a what I want to do:
Start with a graph on $n$ vertices and number them $0, 1, 2, …, n-1$. Then for a fixed $c$ compute $b = c i \, (\rm{mod\, } n)$ and connect $i$ and $b$ in the graph. That’s all. The following code will provide an interactive Sage environment that you can change $n$ and $c$.
def modular_multiplication_graph(n,c):
    #n: number of vertices
    #c: multiplier
    #a: mod this number, default is n

    # get the positions of the vertices in a cycle
    Pos = (graphs.CycleGraph(n)).get_pos()

    # The dictionary that defines the vertices
    D = {}

    # Adding edges between each i and c*i mod a
    for i in range(1,n):
        b = mod(c*i,n)
        #ignoring loops
        if i != b:
            D.update({i:[b]})

    G = Graph(D)
    G.set_pos(Pos)

    return(G)
And the usage is as follows:
@interact
def _(n=(2..200), c=(2..200)):
    G = modular_multiplication_graph(n,c)
    G.show(vertex_labels=False,  vertex_size=3, edge_color='blue', edge_style='solid')
To run the code click on the link: SageCell
Here is some sample generated graphs for different values of $n$ and $c$:
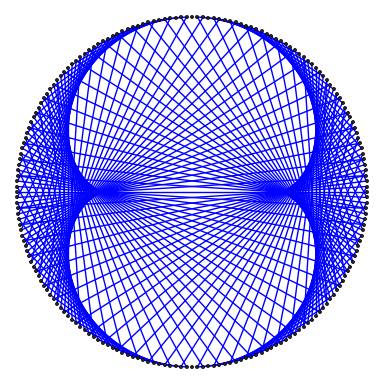
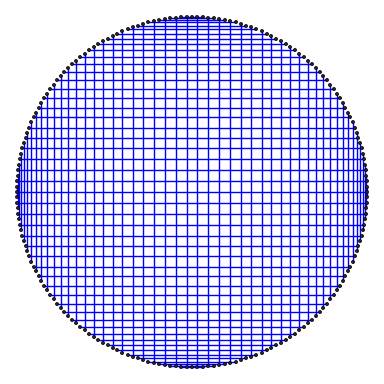
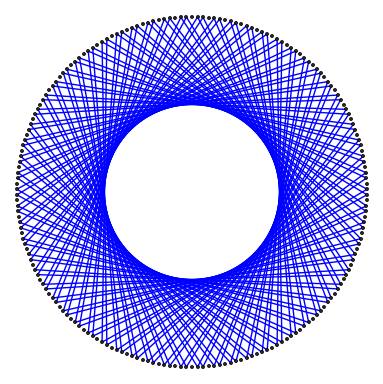
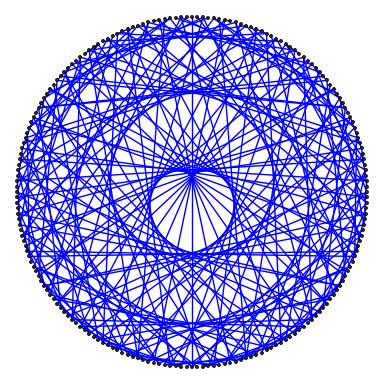
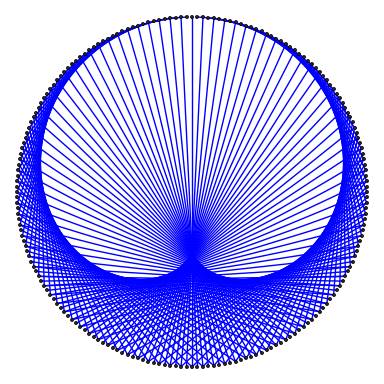
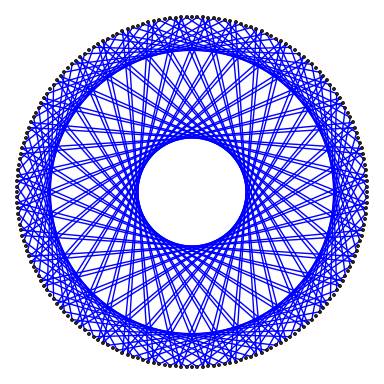
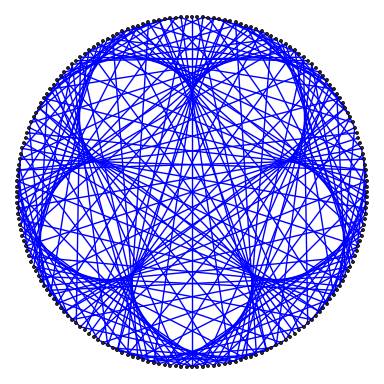
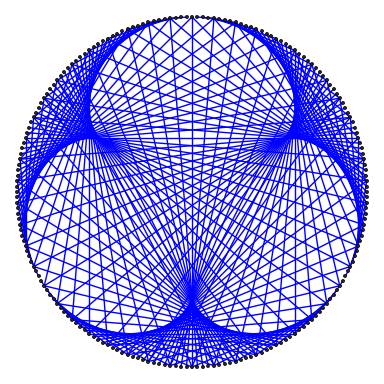
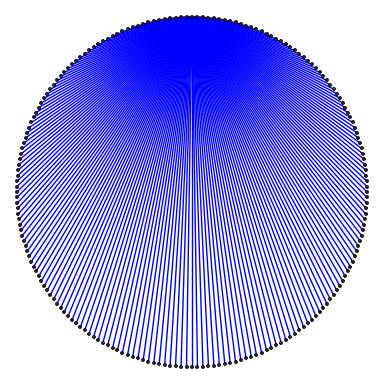
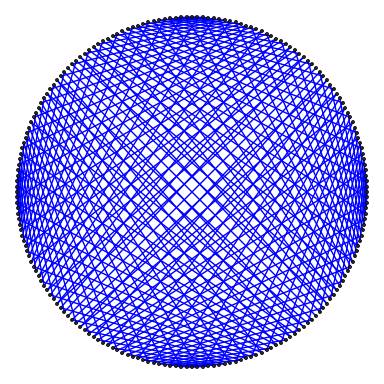
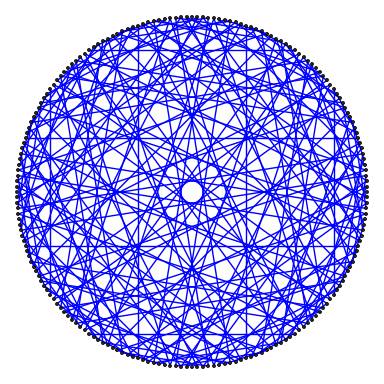
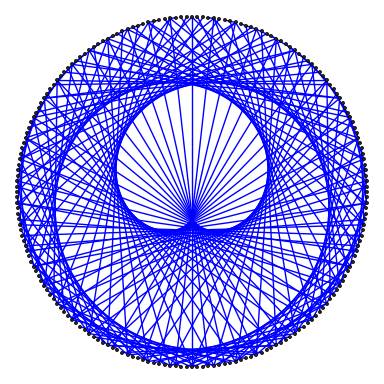
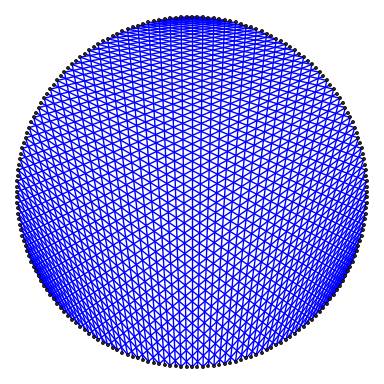
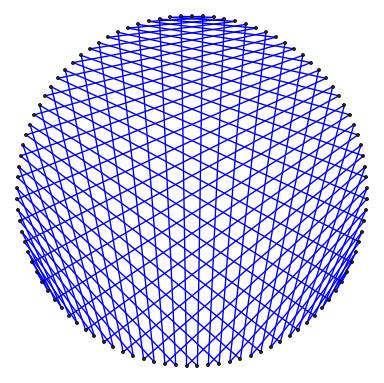
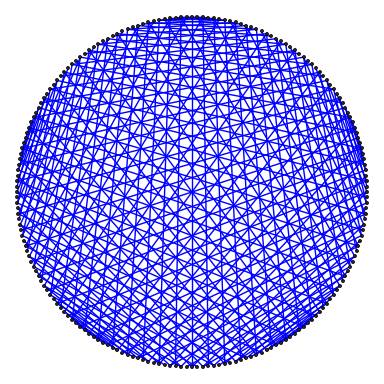
One interesting variation of this is to keep $n$ large and change the base of the modulus. Here is a link to the GitHub file.
Leave a comment