Playing catch with Poison
My friend asked me this: Put balls into $n$ buckets uniformly at random and count $h$ the number of buckets with at least one ball in them. What is the expected value of number of balls $k$?
Let me do this differently. First the direct questions: Divide a square into $n$ smaller equal squares, and pick $k$ points in the big square uniformly at random. On average how many little squares have at least a point in them?
Here is a little sage demo and a sample output
def random_balls_in_buckets(np,ns,verbose=0):
    #np = number of points
    #ns = number of subdivisions of each side of the square
    P = [(random(),random()) for i in range(np)] #chose the random points

    plot_points = points(P,size=20,color='red')
    plot_lines = [line([(0,i/ns),(1,i/ns)]) for i in range(ns)]+[line([(i/ns,0),(i/ns,1)]) for i in range(ns)]+[line([(0,1),(1,1)]),line([(1,0),(1,1)])]

    A = matrix(ZZ,ns,ns)
    for p in P:
        i = floor(ns * p[0])
        j = floor(ns * p[1])
        A[i,j] = 1
    nb = sum(sum(A))

    if verbose == 1:
        text_plot1 = text("number of balls:", (.49,1.1), horizontal_alignment='right', color='red')
        text_plot2 = text(str(np), (.51,1.1), horizontal_alignment='left', color='red')
        text_plot3 = text("number of buckets:", (.49,1.05), horizontal_alignment='right', color='blue')
        text_plot4 = text(str(nb), (.51,1.05), horizontal_alignment='left', color='blue')
        (plot_points+sum(plot_lines)+text_plot1+text_plot2+text_plot3+text_plot4).show()

    return(nb)

np = 200 #number of points
ns = 10 #number of subdivisions of each side of the square
random_balls_in_buckets(np,ns,verbose=1)
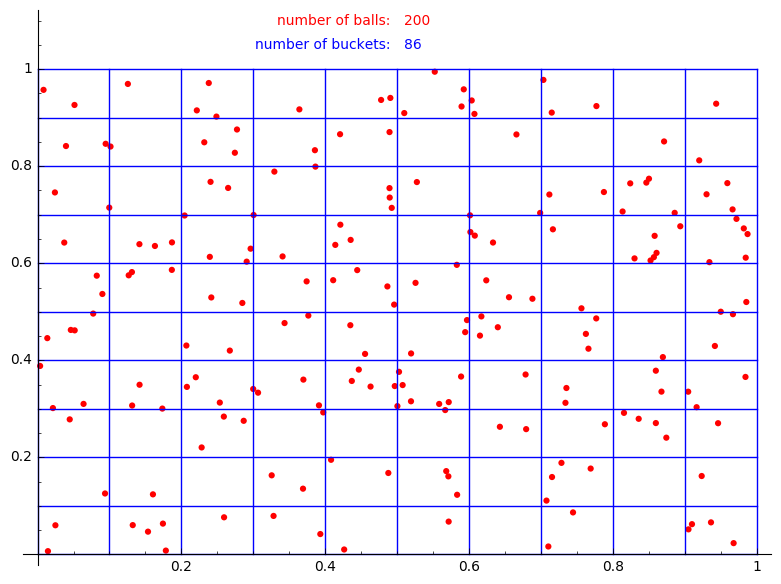
The number of buckets without any balls in them follows the Poison distribution with $\lambda = \frac{k}{n}$, and parameter $0$. We want to count the number of non-empty buckets which will then be $h = n (1 - e^{-\frac{k}{n}})$. So, in order to guess how many balls where there if $h$ buckets are non-empty, all I need to do is to solve the above equation for $k$, which will tell me $k = -n \ln(1-\frac{h}{n})$. For example, if I have 87 non-empty buckets out of a total of 100 buckets, then I have thrown approximately 204 balls.
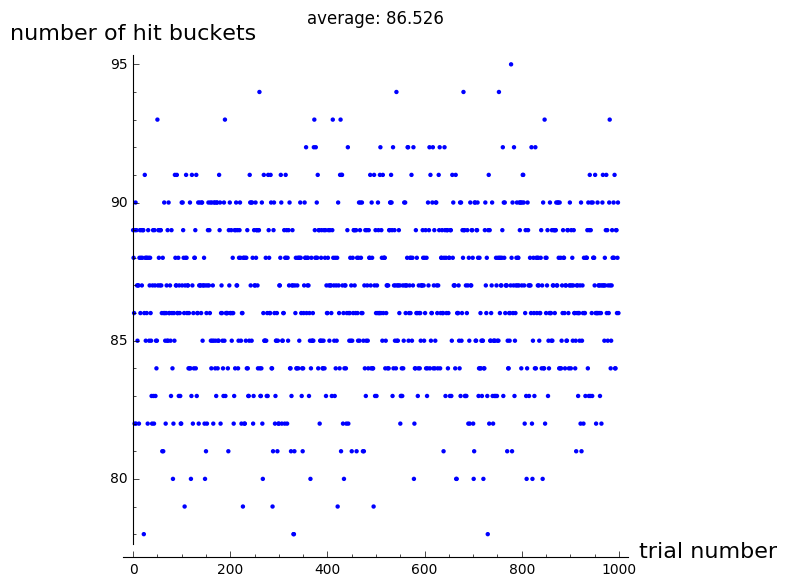
So, if I repeat the above experiment 1000 times,
#let's try this a few times
nB = [] #list of number of hit buckets for each trial
n = 1000
for i in range(n):
    nB += [random_balls_in_buckets(np,ns,verbpse=0)]

P = [(i,nB[i]) for i in range(n)]
histogram = points(P,title='average: '+str(float(mean(nB))), axes_labels=['trial number','number of hit buckets'])
histogram.show()
then I’ll get
One natural question to ask is how many balls shall we throw to be 95% certain that 50% of the buckets are hit? I don’t remember my confidence intervals, but a numerical experiment shows:
ns = 10 #number of subdivisions of each side of the square
nB = [] #list of number of buckets for each trial
n = 1000 #number of points
for np in range(n):
    nB += [random_balls_in_buckets(np,ns,verbpse=0)]

P = [(i,nB[i]) for i in range(n)]
histogram = points(P,title='average: '+str(float(mean(nB))), axes_labels=['number of balls','number of hit buckets'])
var('k')
curve = plot(ns^2 * (1-exp(-k/ns^2)) ,(k,0,1000),color='red',thickness=3)
(histogram+curve).show()
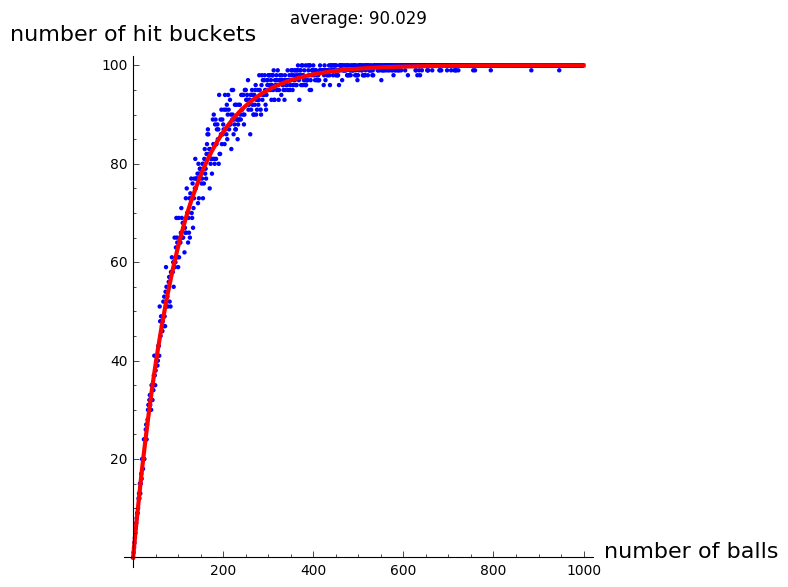 Of course the red curve is $h = n (1-e^{-\frac{k}{n}})$.
Leave a comment